Apps
In this section we would like to compile work done using our API, including our own work and that of others who have made use of our open API. Feel free to send us examples of your work with Goteo API data to be added to this section.
The types of work we envision featuring here include, but aren’t limited to:
- Visualizations and stats, from programmers at any level.
- Explorations and conclusions, for more "discursive" people and fans of hypotheses and confirmations.
- Research about the needs (monetary and non-monetary) of crowdfunding campaigns to focus on the balance between what is requested and what is received in each campaign.
- Studies on “feeder” capital and "CSR multipliers", to motivate those with a stake in the future of Goteo in strengthening match-funding and new institutional agents.
- Mobile applications using the API.
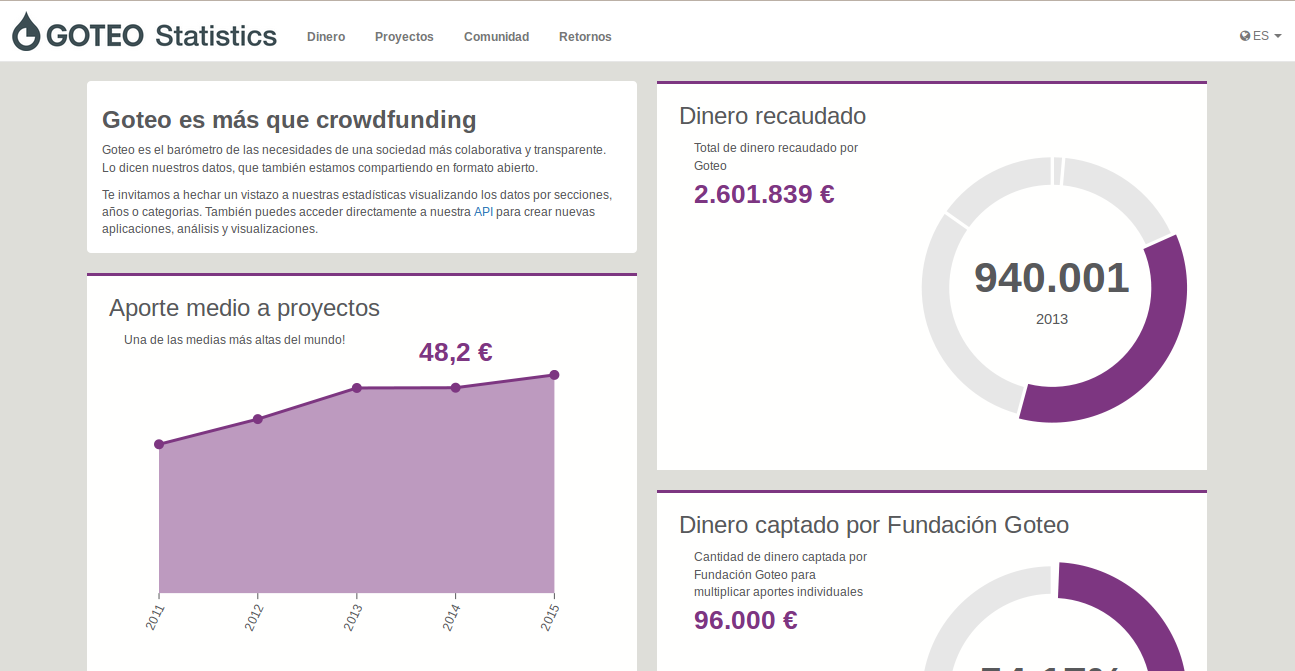
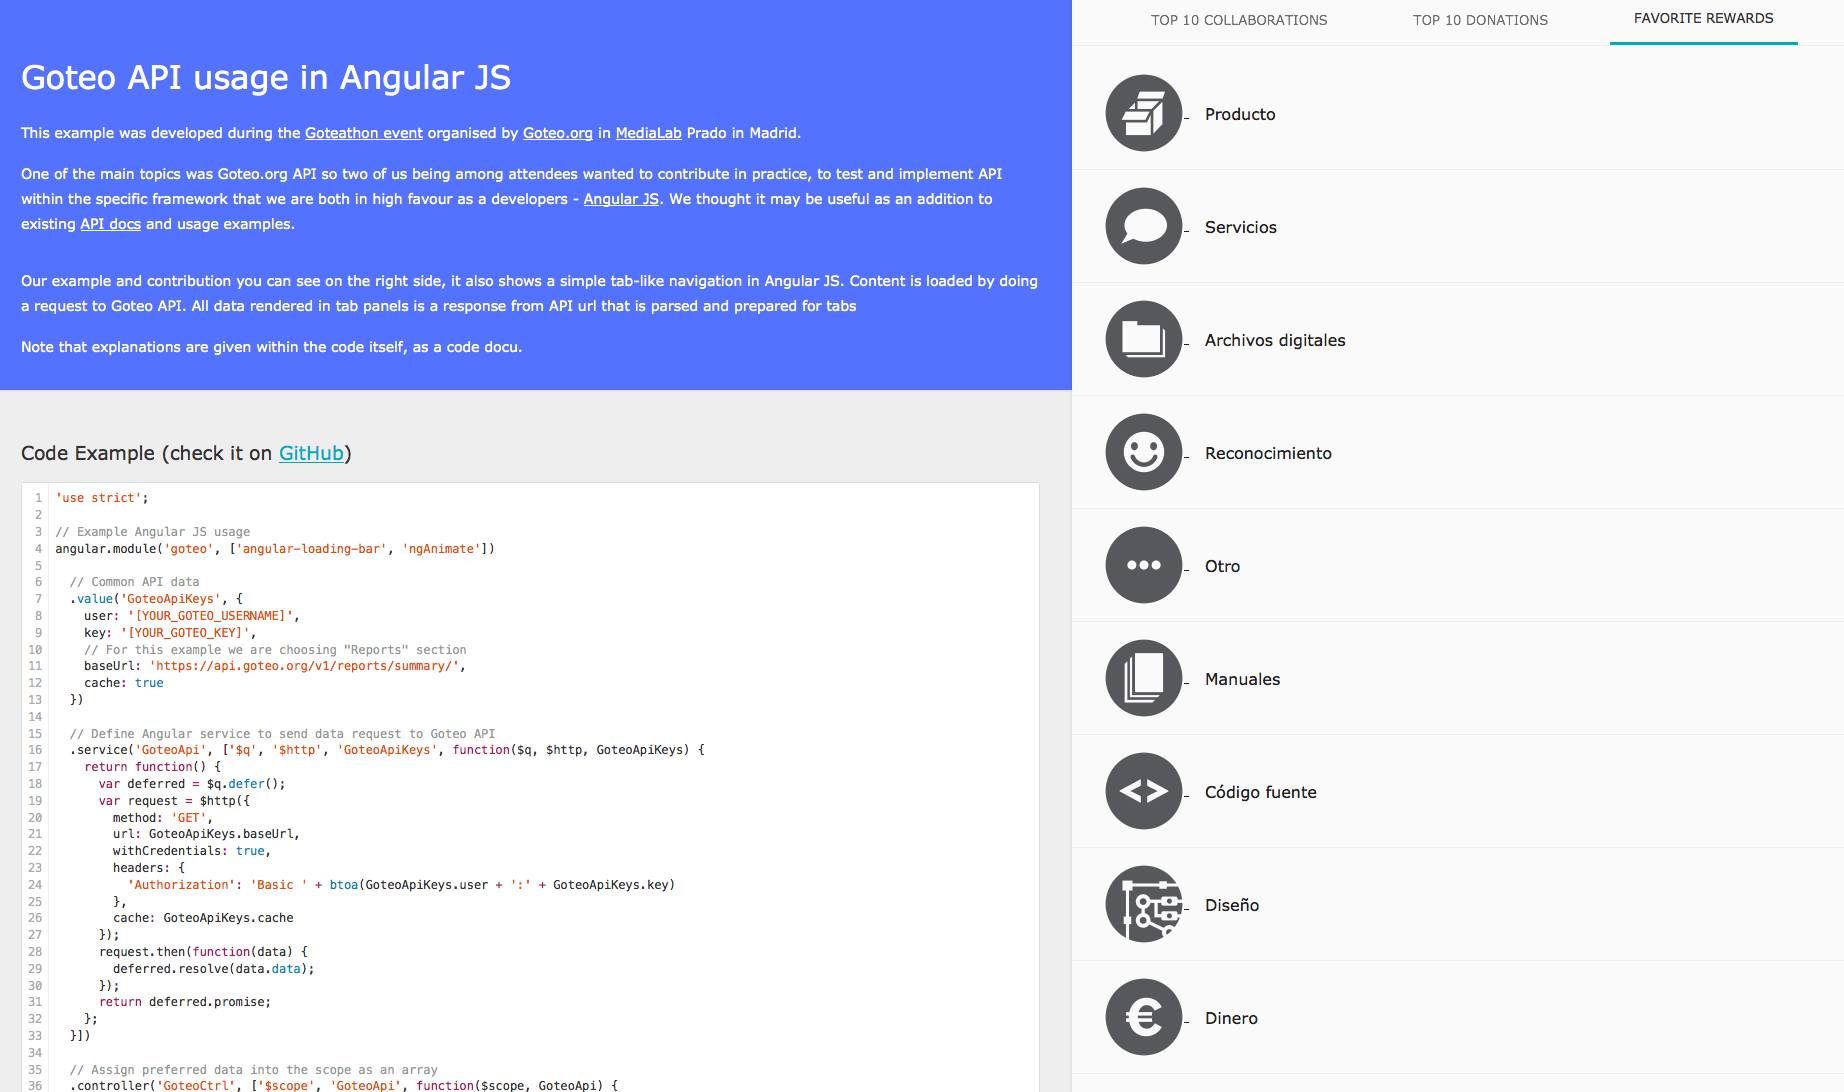
Outliers Goteo Visualization
The following image is a representation of Goteo's statistics, visualizing data by sections, years and categories. Here you can see all kinds of relevant information displayed graphically, including the top 10 projects with the highest donations, the total number of projects published by year, the different categories of interest for projects, and the breakdown of favorite individual rewards, among other statistics.
Platoniq Labs
This is an application that shows interconnections between the money raised by the Goteo Platform and the Democratic Online Platform Decidim from the city of Barcelona.
It uses the Sustainable Development Goals to let the user play around projects and invests related with them. At the same time it mixes the relevant meeting places extracted from Decidim where citizen initiatives have been taken place.
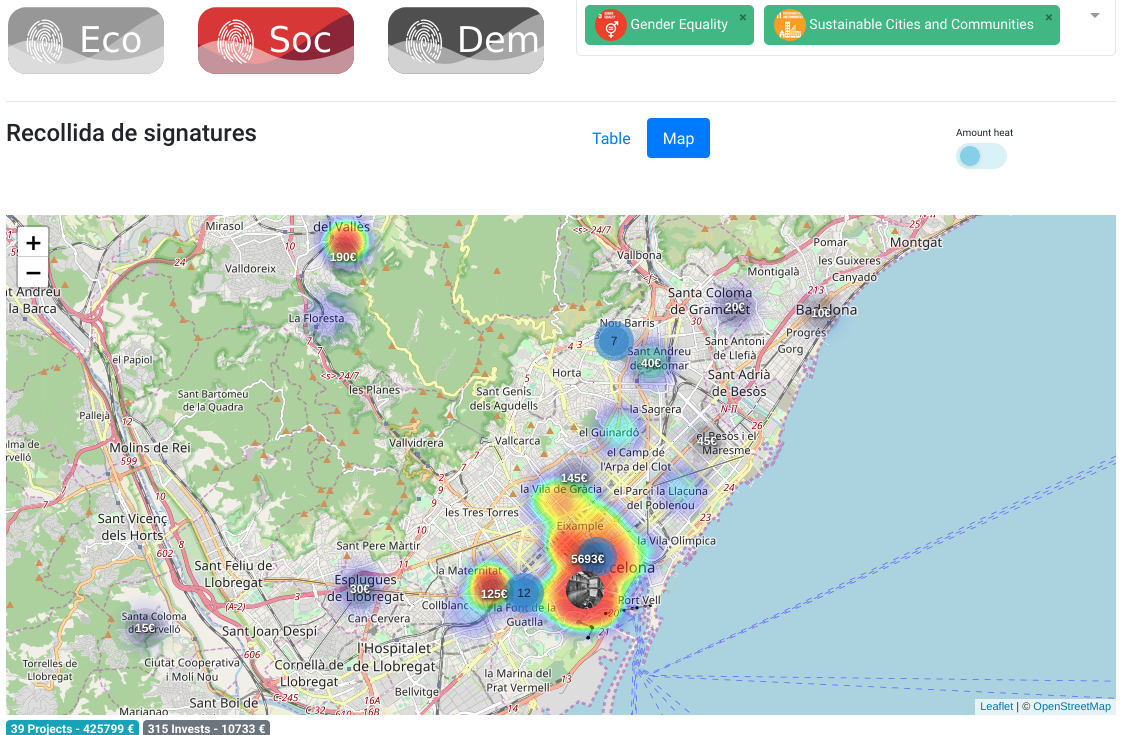
Matchfunding Visualizations
These are widgets that can be shared across different websites that represent the impact of the projects in the territory around Matchfunding calls in Goteo. Every Matchfunding Call co-finance some projects alongside with the user final contributions. These visualizations show the relationshiop between the Matchfunding call, the projects and the final contributions.
Demo ECF Labs
The demo was made by the ECF Labs team at the Goteathon even in Madrid, using AngularJS
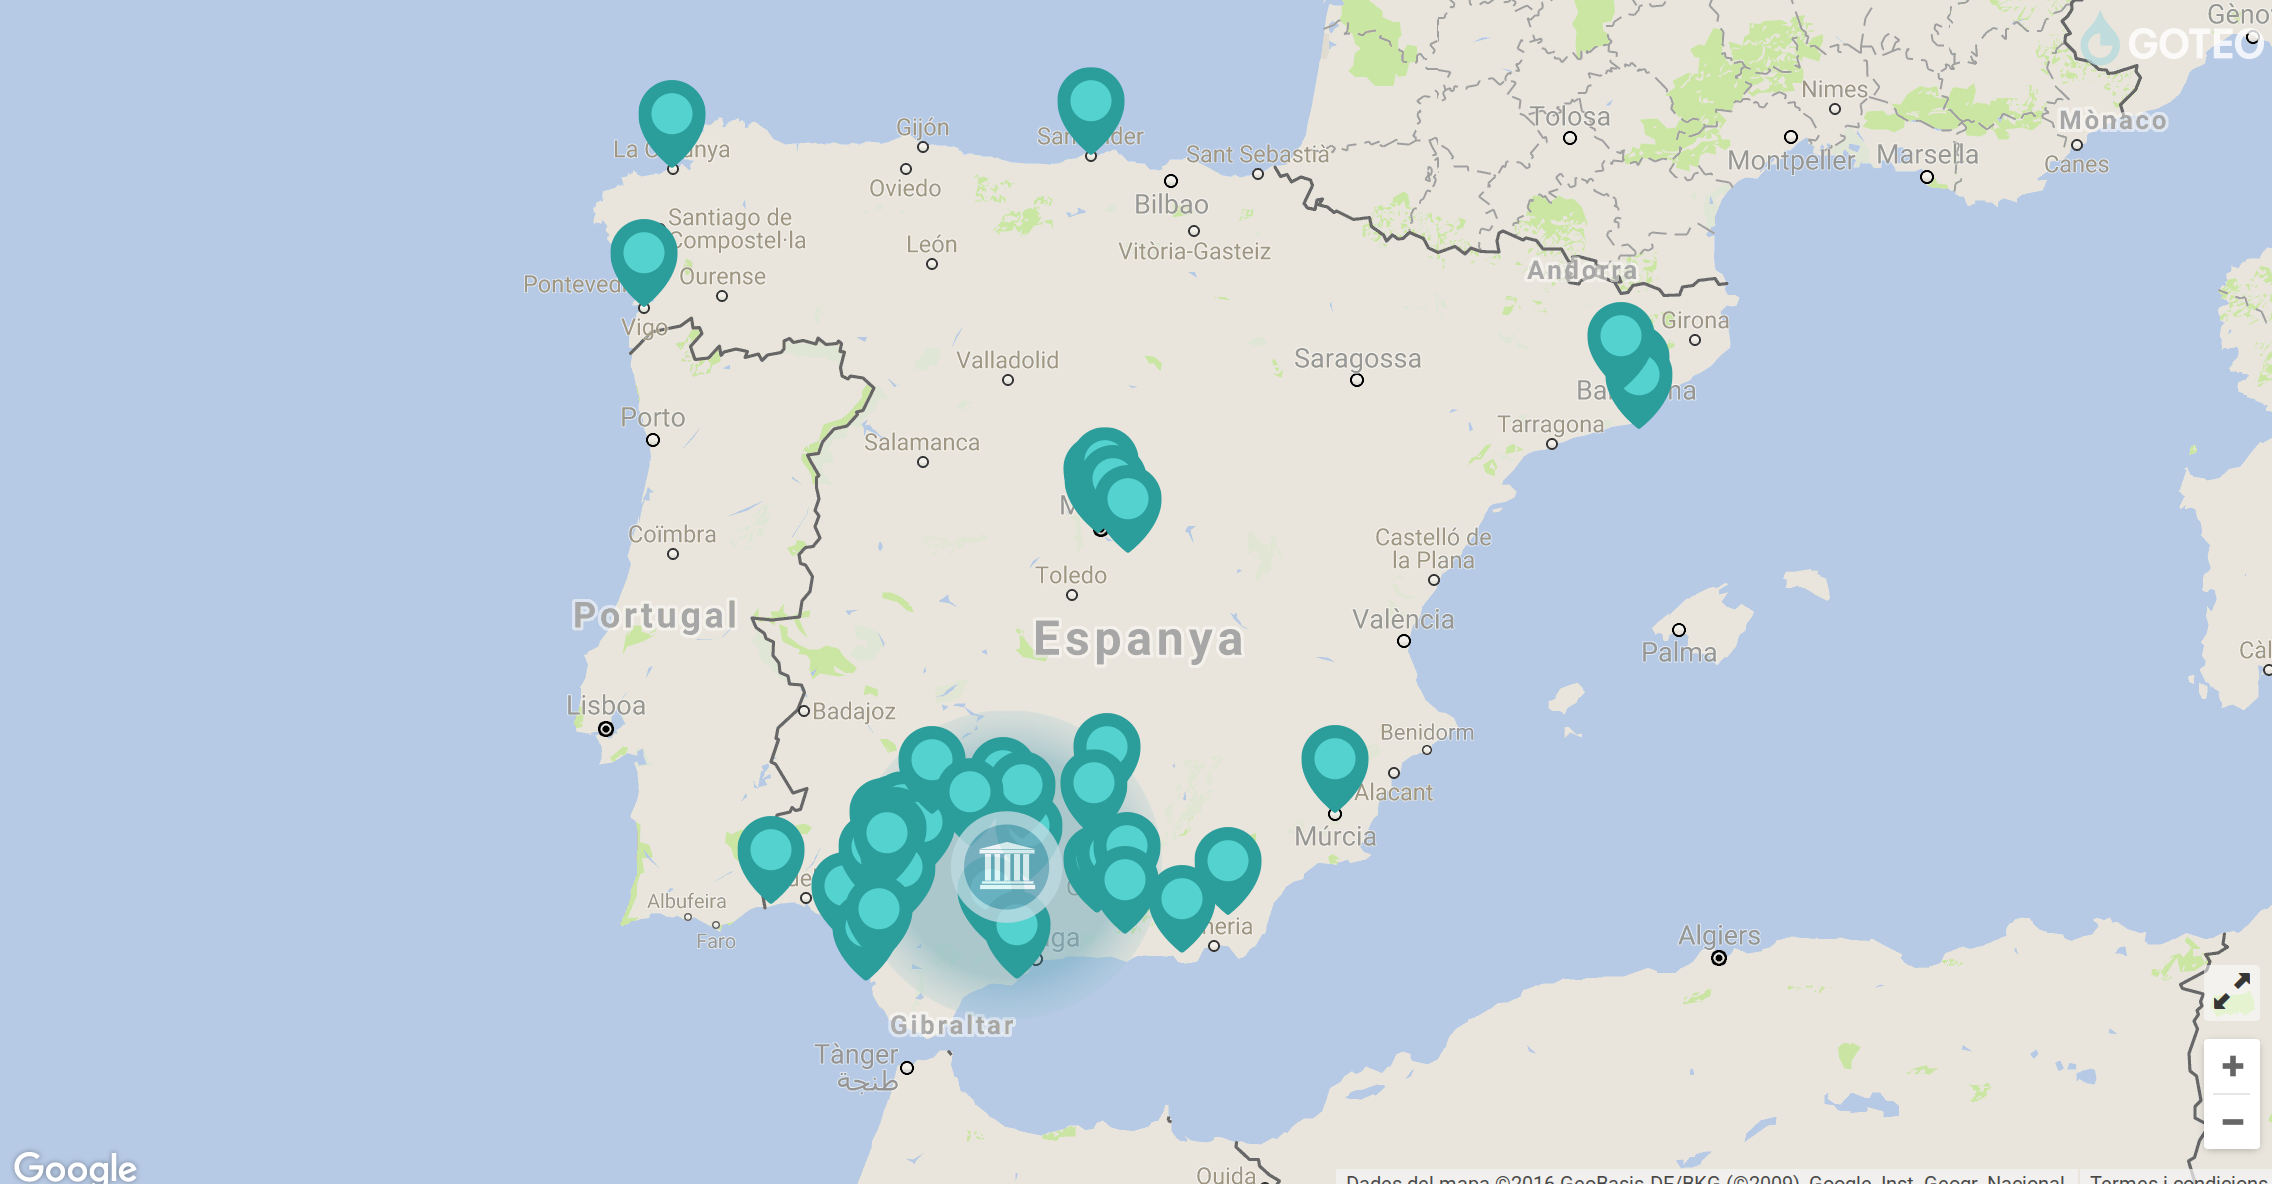
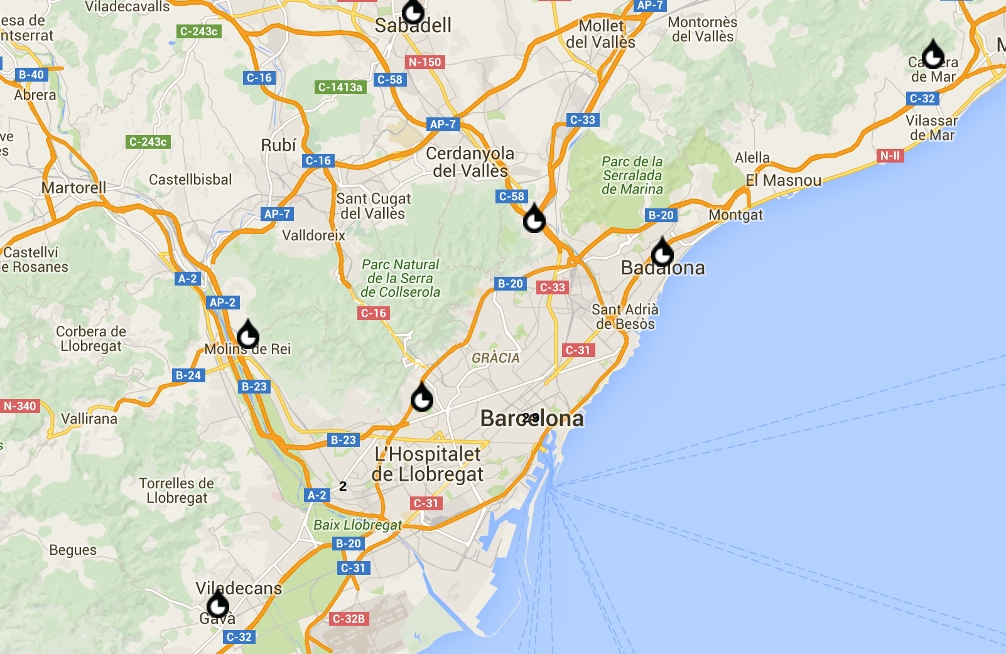
Barcelona Goteo Projects
The following map is a representation of Goteo's projects in Barclona.
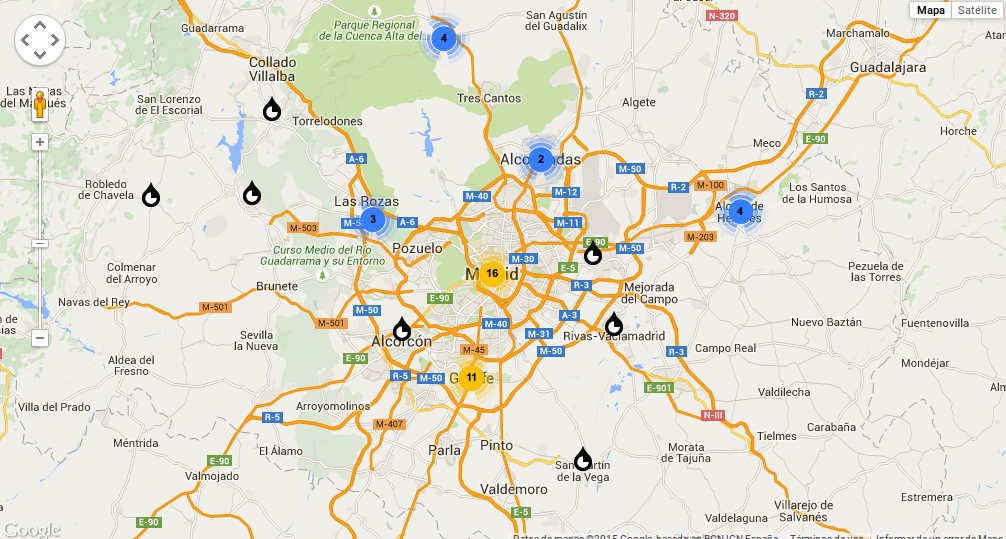
Madrid Goteo Projects
The following map is a representation of Goteo's projects in Madrid.