Basic Stats
Developed by: Outliers Collective
Description
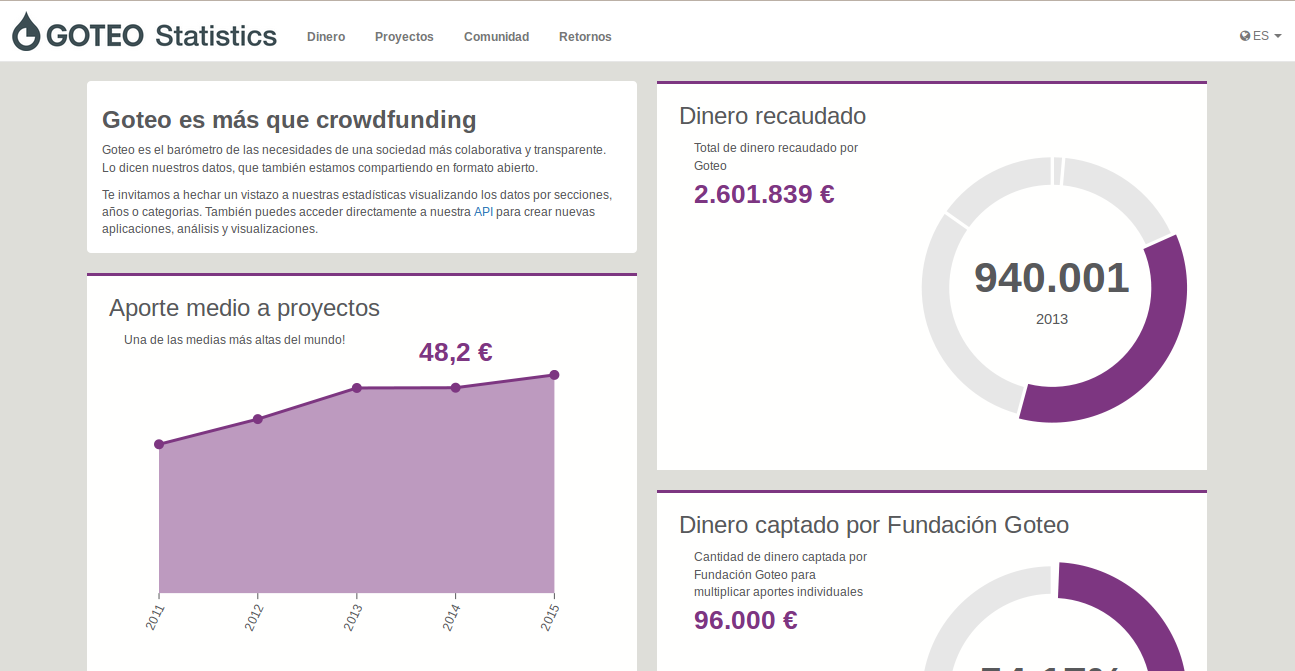
The following image is a representation of Goteo's statistics, visualizing data by sections, years and categories. Here you can see all kinds of relevant information displayed graphically, including the top 10 projects with the highest donations, the total number of projects published by year, the different categories of interest for projects, and the breakdown of favorite individual rewards, among other statistics.
Technical information
- Angular
- Bootstrap